Creating Music Metrics and Modeling Artist Relationships with Spotify's API
"Music can change the world." - Beethoven
As a long-time Spotify user, I've noticed a few things about the platform that have been changing. Spotify has become much more than a streaming service. Now, it gives you recommendations for what songs you might like automatically creates playlists each day for you to listen to, hosts podcasts, and has Artist metrics that you can use to determine their overall popularity, the list goes on and on.
As a Statistics and Computer Science student at UIUC, I love working with data that I can visualize. Spotify's music data is no exception. Wouldn't it be cool to see unique song metrics that you can hear in the music? What if you could create custom metrics that would tell you how likely you are to like a particular song?
I had these questions and more not too long ago. And so, I set out on a quest to answer the following questions:
- Given any random song, what's the likelihood that I'll like it?
- Given a discography, can I rank the songs from most likely to enjoy to least?
- Can I model Spotify Artists as a weighted graph?
- Can I determine the smallest number of intermediate artists between any two artists on Spotify?
- How can we traverse artists by genre?
After many cups of coffee and many more lines of code, I think I've come up with lots of surprising results.
Problem 1: Computing the Likelihood of Enjoying a Track
Gathering the Data
To get all the data that we need for these insights, we're going to be using the Spotify Web API and its python wrapper module, Spotipy.
Spotify's API can allow you to do just about everything that you could in the desktop app. You can make playlists, like songs, get artist information, etc. We can also gather additional statistics that aren't exposed publically through the Spotify desktop application. What other properties could Spotify have about songs that aren't its genre, duration, and tempo? What else are they hiding?
The Echo Nest and Song Metrics
In 2014, Spotify acquired the Echo Nest, a small company in the Greater Boston Area that was working on a dynamic music classification algorithm. The engineers on the team created a set of song metrics that are unique to each song and are generated from a track's waveform. Some example of these new song metrics are:
- Speechiness: A number between 0 and 1 that predicts how likely it is that this track contains only speech.
- Danceability: A number between 0 and 1 that predicts how likely it is that a person would be able to dance to this track.
- Energy: A number between 0 and 1 that describes how "energetic" this track is.
There are a few others that I won't mention now, but you get the point. Every song on spotify has a unique set of these features that we can obtain by using its API. The only thing left to wonder is: what can we do with these features?
Let's create a new metric, just like the ones above, called likeability. This number is unique per song per user, and describes how likely we are to enjoy a track given our previous listening history. How would we go about finding this number?
To start, we would need to know what our current music taste is. Then, we'd compare the features of our recent listening history to that of a given song to get a distance measure of how far this song is from our ideal music taste. Finally, we would map this value between 0 and 1 so that we can interpret it as a likelihood. Let's get started.
Getting our Recent Listening History
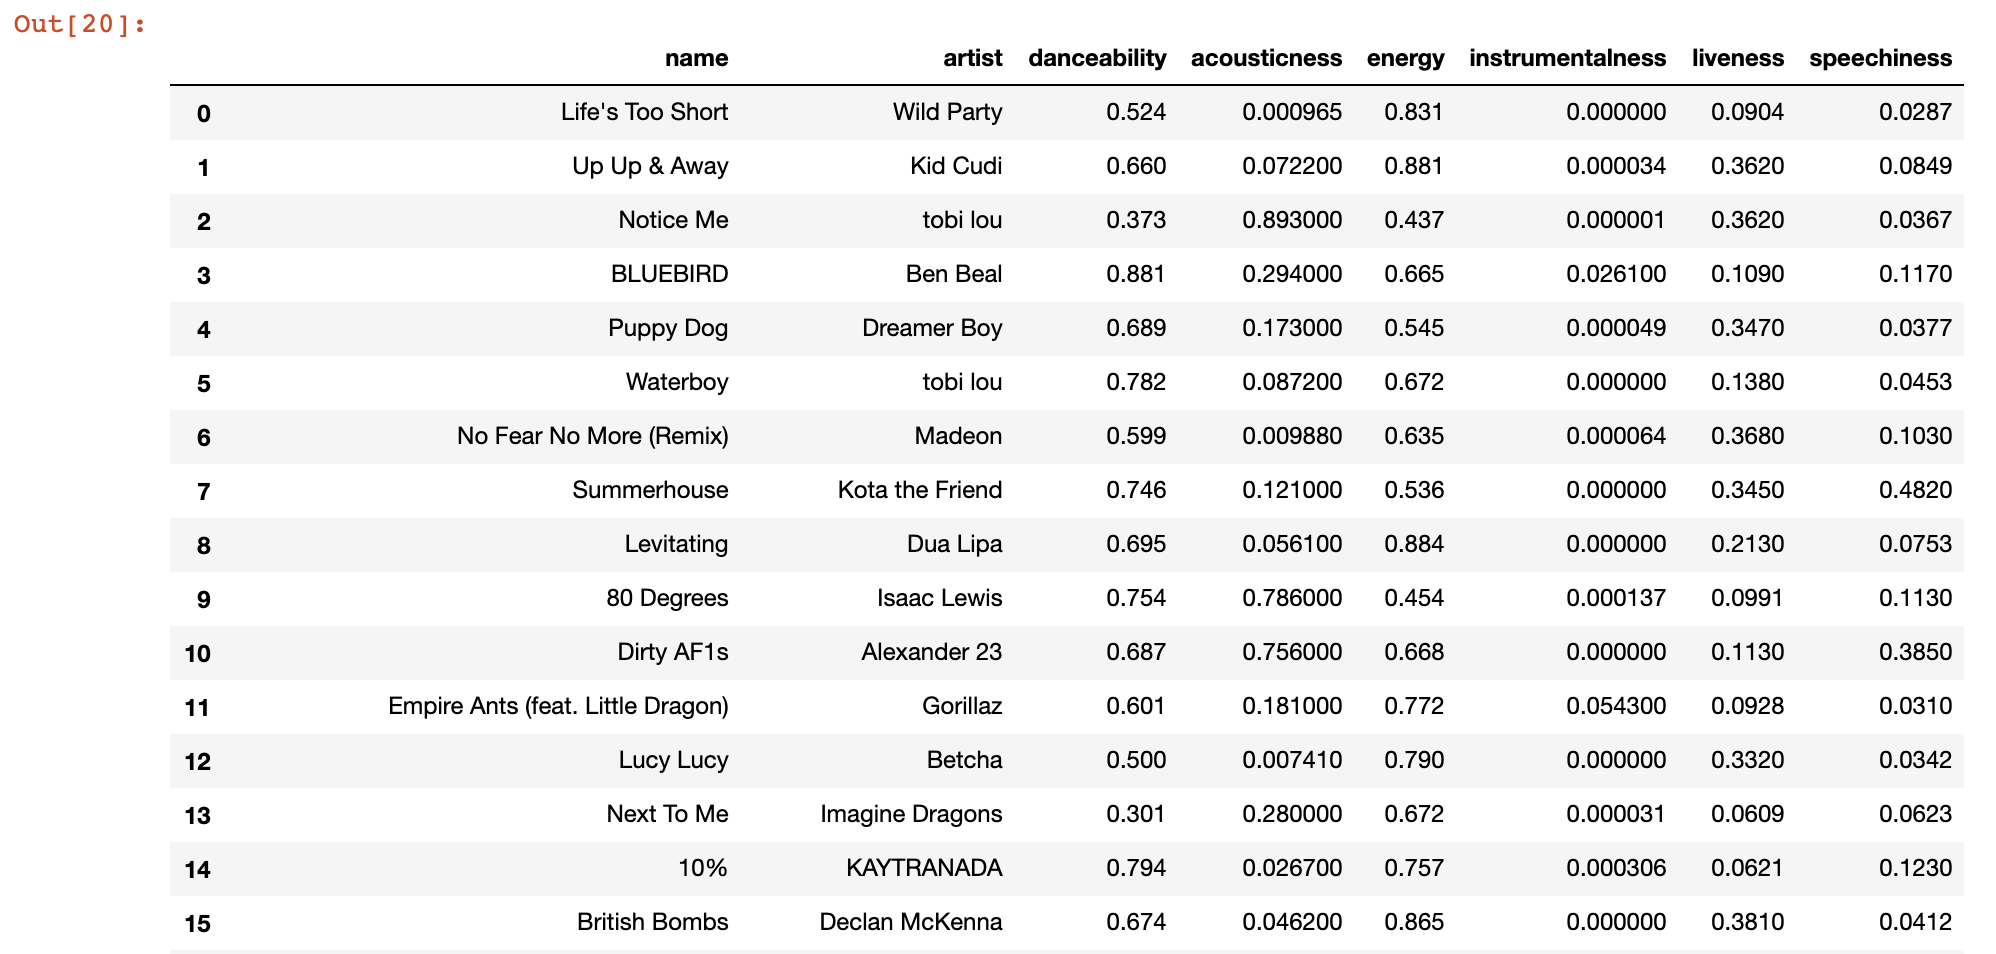
As it turns out, Spotify allows us to get a ranked list of all of our top songs over three different time ranges: short, medium, and long. Let's download all of my top tracks over a short timeframe, and pull all of these tracks' metrics and additional information:
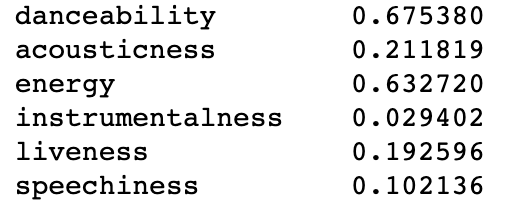
Now that we have our recent listening history, we want to get a sense of what our ideal feature values are for a song. To do so, we can take a weighted average across all our songs' metrics to get a vector that represents our ideal song metric values.
The Likelihood Function
We'll define the likelihood function like so:
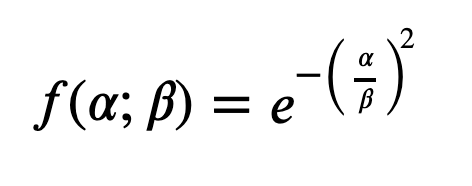
where Alpha is calculated by summing the unsigned z-scores across all m features in our song, and Beta is a pre-defined constant that scales our function. In this sense, alpha is the total number of standard deviations away that any one song is from our ideal metric values.
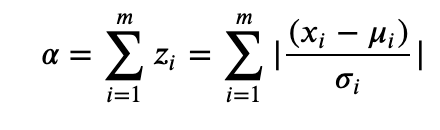
The smaller the value for alpha, the fewer standard deviations away this song is from our ideal feature values, and therefore we are more likely to enjoy this song. We could also use other measures of distance, too: for example, the dot product between the "ideal" values vector and another tracks' vector will give some measure of similarity. As would the cartesian distance between these points in m-d space. After a few iterations, I settled for z-score sum, because it gave me the most anticipated results.
Results
After finding the standard deviations for all m features, I decided to feed a random song into my algo to see the output. The value for Beta used for the likelihood function is 8.5.
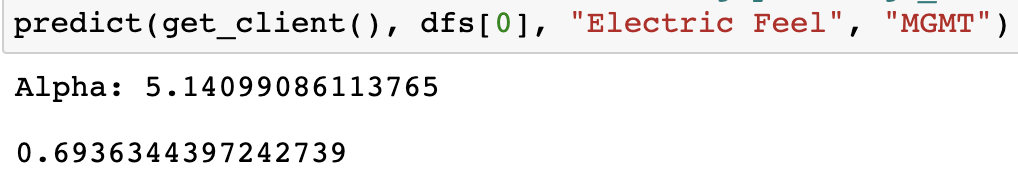
NOTE: Beta = 8.5 is only half arbitrary. It was calculated by finding the value for beta such that the point of inflection on the graph would be roughly at x=m.
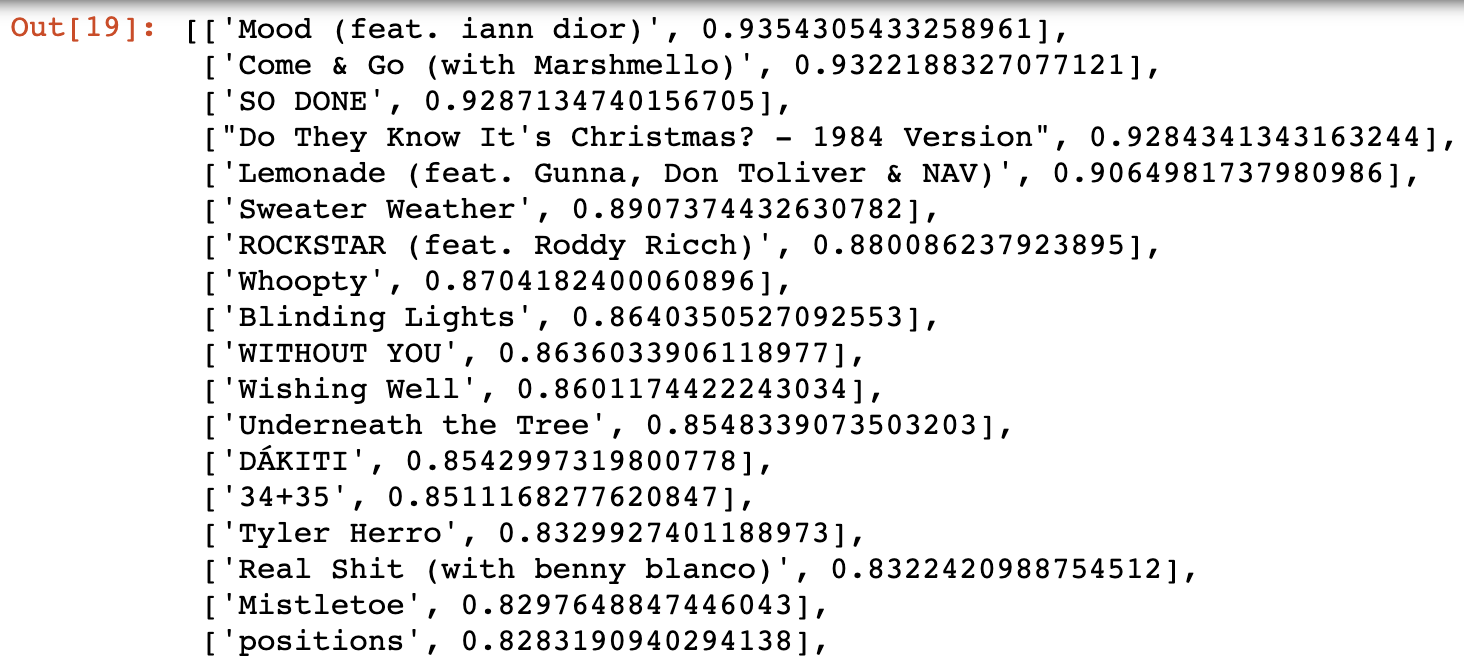
For fun, I also decided that I could compute the likeability for the US Top 50 songs to see which ones I would most enjoy.
Problem 2: Ranking an Artist's Discography
The motivation behind this is as follows: Suppose you find a new artist on Spotify that you really like. You check out their artist profile to see that they have about 50 songs. Spotify gives you about 5-10 recommended songs for you to listen to, but these recommended songs are agnostic to the user. They are simply that artists' most popular songs of all time and at the time.
What if, instead, when you visited an artists' page on Spotify, they gave you a list of songs from that artist that you are most likely to enjoy? Well, that's where our algorithm comes in!
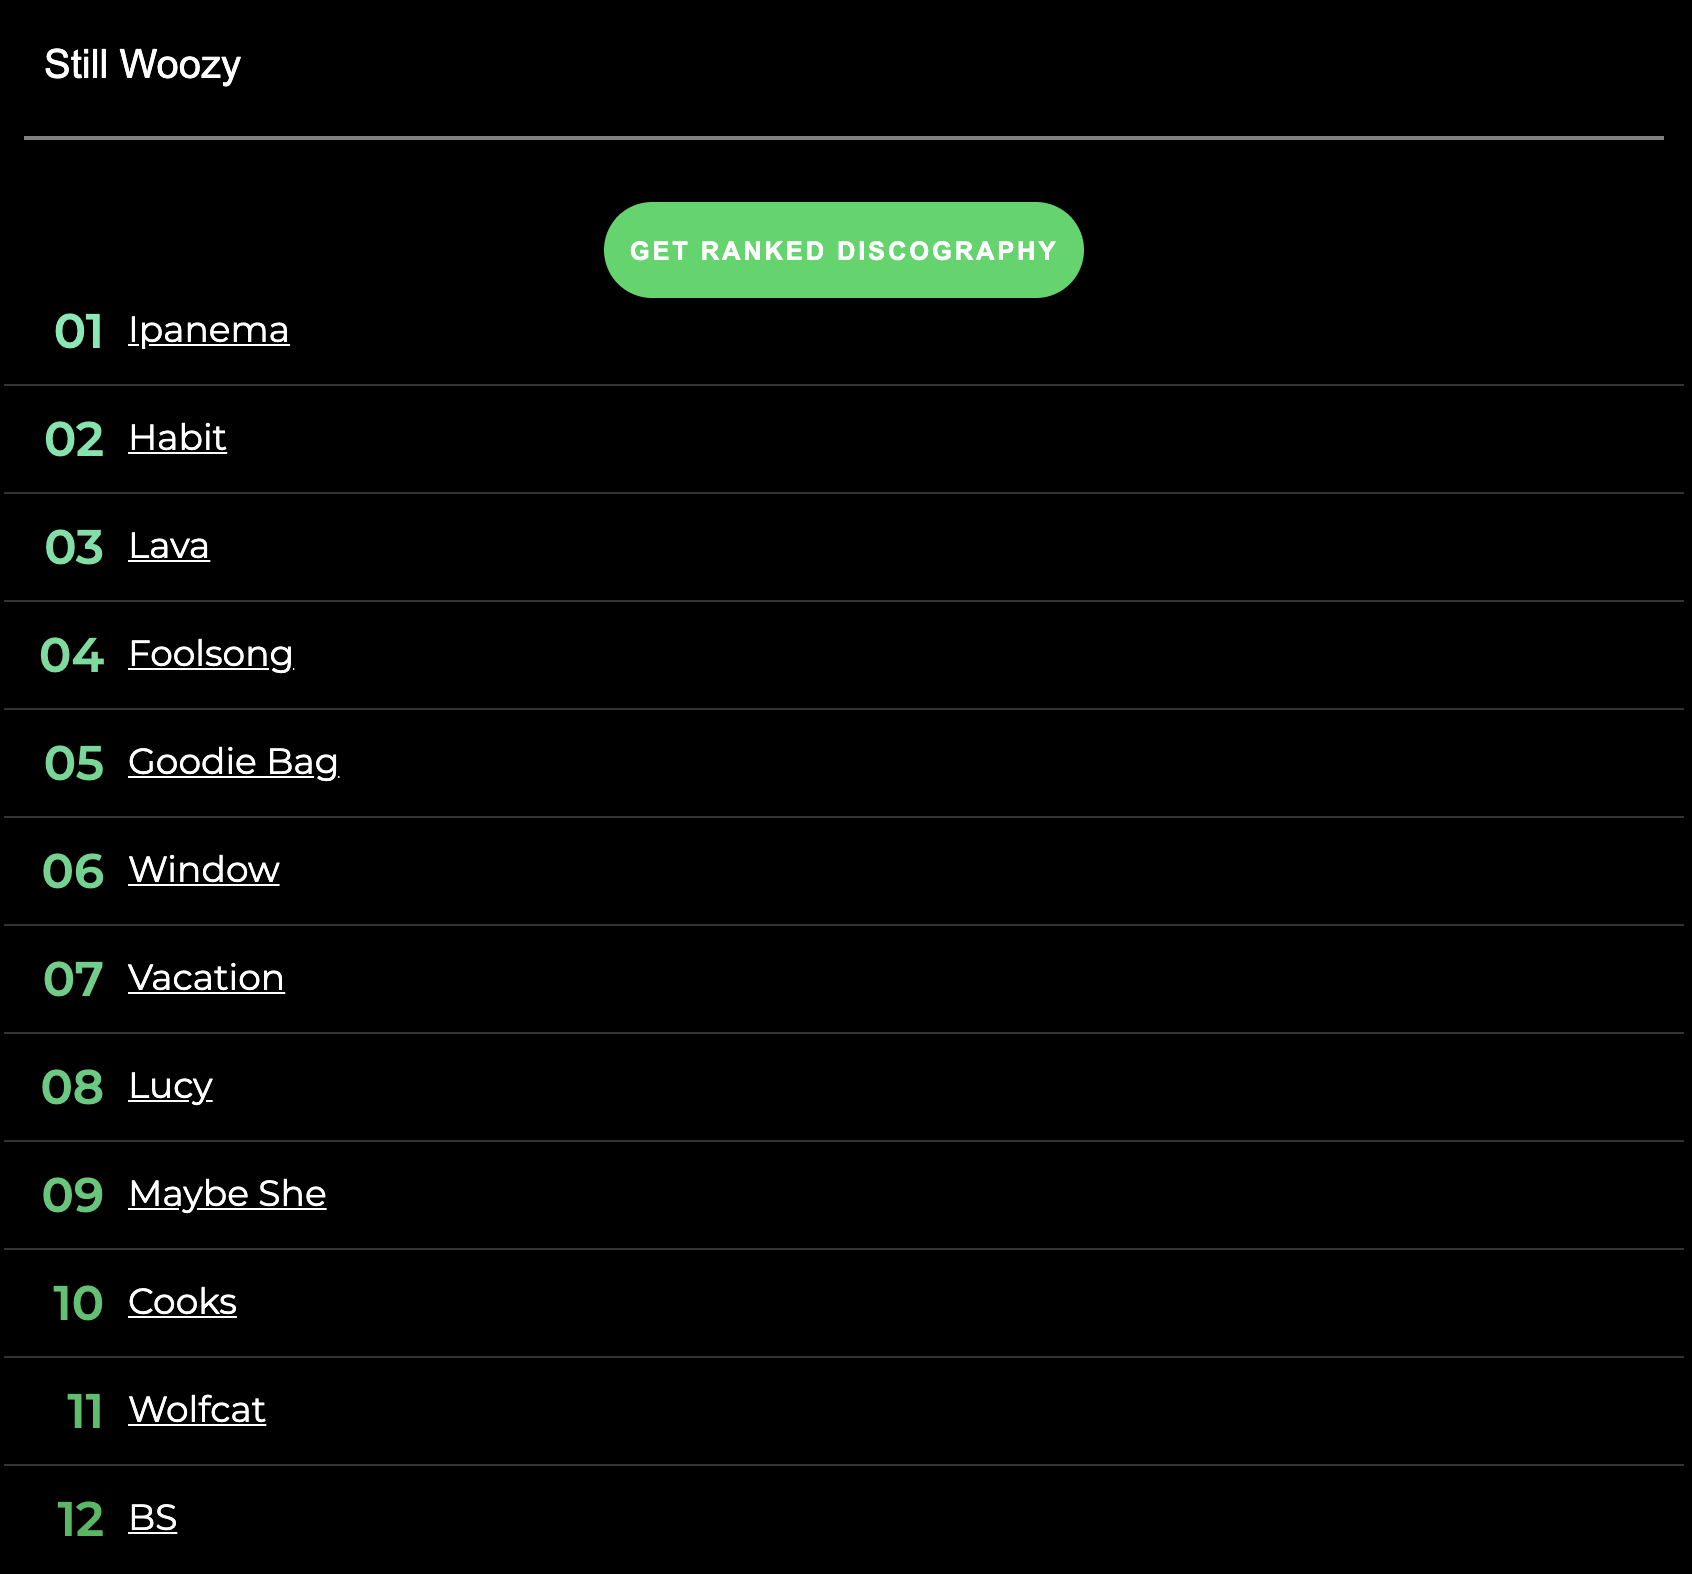
I made a small tool called [Artistly (https://github.com/daviskeene/Artistly) that generates ranked discographies for artists using Spotify OAuth and Django. I may try to deploy this in the future, but for now you can check out the code and play around with the app using the link to the Git repo.
Here's an example:
Problem 3: Modeling Related Artists as a Weighted Graph
I took a data structures class this past semester that had us learn about lots of different graph traversal and path-finding algorithms. While playing around with the Spotify API (and from using the product), I noticed that all artists are given a list of artists that they're related to. These relations are typically defined by genre, and it's used mainly for artist discovery in the Spotify web app.
I had the idea to model this graph of related artists as a weighted network graph, and perform some of the aforementioned algorithms on the graph to get a better picture for how artists are related in Spotify's internal network.
Artists on Spotify are related by their genres, and what listeners of one artist are also listening to. I'm not sure how related artists are actually calculated, but I do know that every artist has related artists. In this way, we can imagine Spotify Related Artists as a Network Graph, with edges that connect artists of a similar genre.
All of the code (and most of the following text) can be found here.
Loading the Data
The code for most of this was done in C++, and the data was again pulled from the Spotify API. I wrote some python code to pull artist and related artist data into a CSV, and I read this CSV when creating an ArtistGraph instance.
This data is parsed by CSVReader, a class that I had to create in order to read artist data. This CSVReader contains generic methods for parsing any type of CSV, and methods that are specifically designed to pull artist data based on the format of the data.
ArtistGraph is a sub-class of Graph, which has code to obtain Vertex and Edge information. ArtistGraph contains methods and constructors that are used to carry out the algorithms below. The edges of an ArtistGraph are weighted based on the number of different genres between two artists (so, if two artists have many genres in common, they will be 'closer' than artists with many genres that differ).
Algorithms
Now that I have the data loaded, I can do things with it! Here are a few of the algorithms implemented in ArtistGraph.cpp:
- Djikstra's Algorithm for computing the shortest path between two artists.
- Betweenness Centrality for finding the number of shortest paths that pass between nodes (to determine musical diversity and connections).
- A Breadth First Search of the Graph to traverse similar artists first, and then slowly traverse the graph to artists of increasingly different genres.
- The Floyd-Warshall shortest distance algorithm to compute the shortest distance between any two artists in the graph.
Finding the Shortest Path between Two Artists
After loading the data into the graph, we can display the shortest path between two artists.
Here's an example of the shortest path from Future to Kid Cudi:
Future -> Meek Mill -> Big Sean -> Kanye West -> Kid Cudi
The actual path computation uses Dijkstra's algorithm to traverse the graph to find the path, and pushes Vertexes into a lookup table to see its previously visited Vertex. Once we reach the terminal node, we simply return a vector that backwards - traverses the previously visited nodes until we reach the start node.
This gets us the number of artists that separate one artist from another. But remember: we also weighted our edges by the number of different genres between artists. What if I want to get the shortest distance between two artists in linear time?
Floyd-Warshall Matrix
The Floyd-Warshall matrix is an n x n matrix, where n is the number of artists in the graph. Each row and column represents an artist in the graph. The value of the matrix at (i, j) is the value of the shortest distance between artist i and artist j. I can visualize our networks' distances by creating a heatmap:
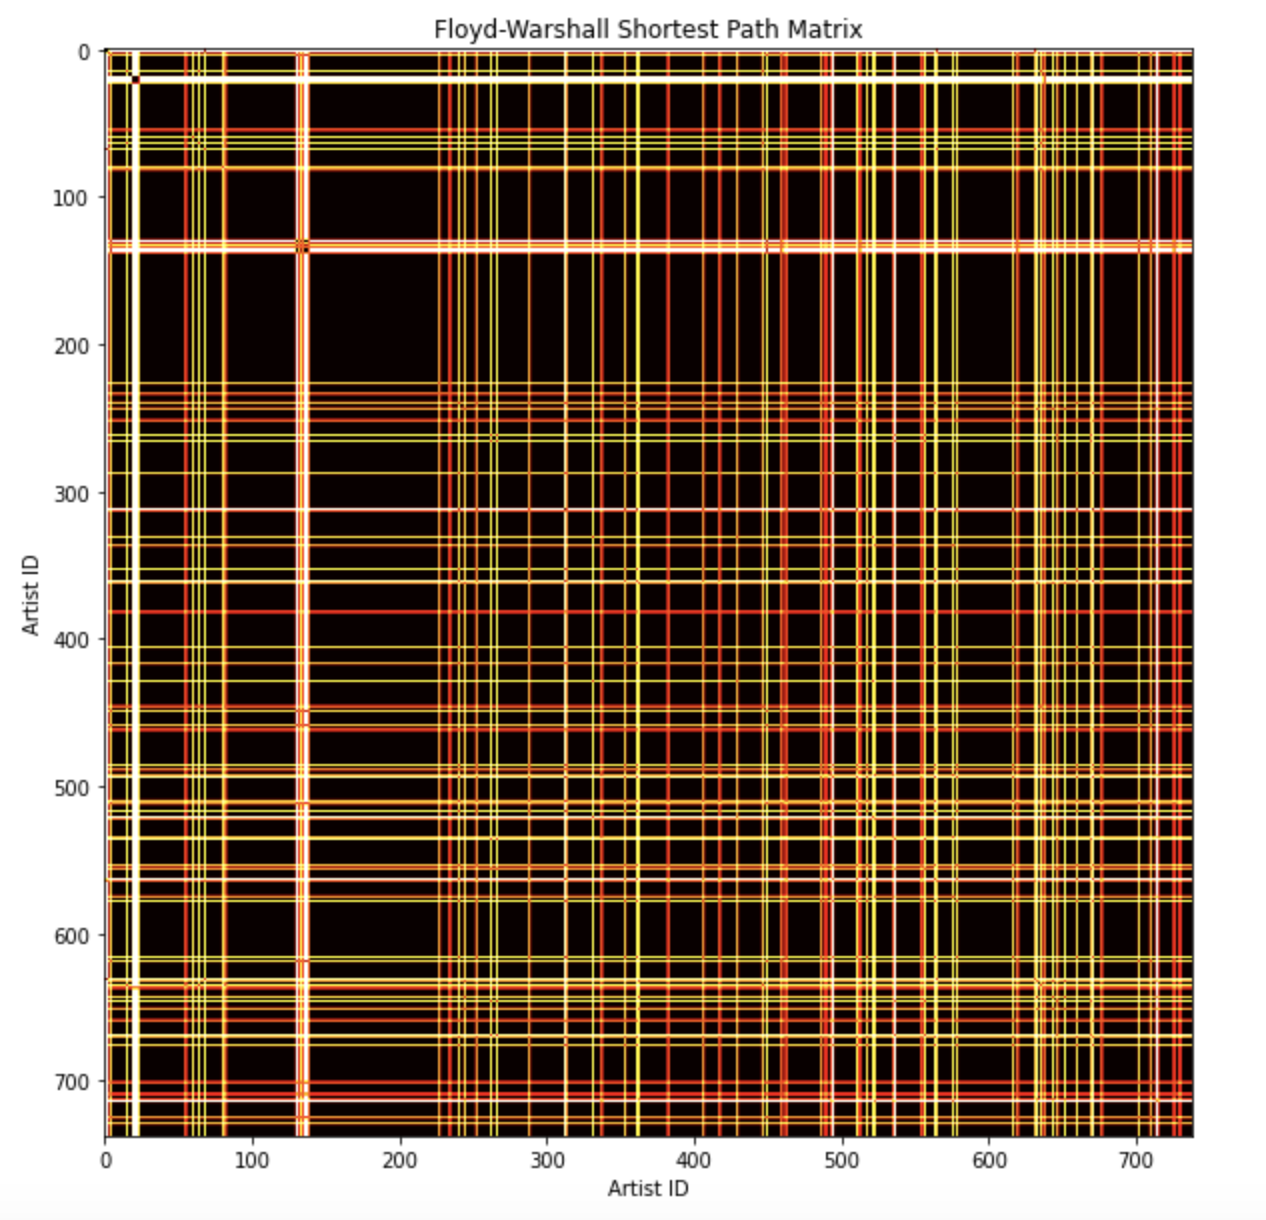
You may notice that this is a perfectly symmetrical matrix along a line with slope -1, and this is due to the following property: the shortest path from artist A to artist B is the same as the shortest path from artist B to artist A.
The colors represent the value of the shortest distance between two vertexes. The distance, in this case, can be interpreted as the total number of different genres that separate two artists along the shortest path between them. It's kind of an odd metric to measure distance by, but it makes sense in context.
The computation of this matrix can be found here in ArtistGraph.cpp:180.
Betweenness Centrality
Betweenness Centrality is a measure of how many times a node acts as a "bridge" between two points (ie. how many shortest paths run through that node). To compute betweenness centrality, we first calculate the Floyd-Warshall matrix that contains the shortest distances between any two artists in our graph.
We can then use this matrix to determine if a shortest path exists between any two nodes. If it does, then we calculate the shortest path and loop through all nodes along that path, storing a map that relates these vertices to a custom struct that stores an artist's name and their centrality score.
A higher centrality score means that an artist is more "central" to the graph. Since they have more shortest paths running through them, we can interpret this as this artist having a diverse enough list of genres / popular list of related artists.
Below is a printout of the centrality scores for each artist. The number next to the artist's name denotes the number of times this artist appears in the shortest path between two other artists. Feel free to Ctrl + F for your favorite artist to see their centrality score!
Here are the results:
As you can see, many popular artists are towards the top of the list, with OneRepublic dominating the competition. This result is expected, because popular artists are more likely to have relations to other artists from other genres. You'll also notice most of the genres of artists towards the top are pop, and this is most likely due to the fact that pop has a blend of many other genres (rap, indie, rock, etc.) so it's easy to hop from these artists to others.
Breadth First Traversal
When traversing a graph of related artists, it makes the most sense to traverse using a Breadth First Algorithm. This is because I want to slowly work our way from one genre (or group of related artists) to another.
Let's start from Kid Cudi, and see where our graph takes us:
As you can see, the traversal starts with artists that are related to Kid Cudi, and has more rappers towards the top. As the list goes on, however, we start to see other genres blending in. Eventually, we make it out of the rap genre and start to enter alt rock / indie, and start moving further and further away from artists that are similar to what we started with.
Concluding Remarks
All in all, it was rewarding to see results that were somewhat expected. To see that popular artists had high centrality scores, that the path between similar artists follow a logical progression, and that the traversal groups artists together + slowly walks away from a starting genre was really cool.
Pretty soon I plan on getting more complicated visuals established for the graph: using a force-directed graph visualization to actually view all of the nodes, drawing out the shortest paths between artists, etc. More of that to come whenever I have free time!